
The Real Estate market in our community remains strong and our outlook for 2020 remains positive. The demand, development, and growth in North Atlanta continues to move in the right direction.
Number of Homes Sold
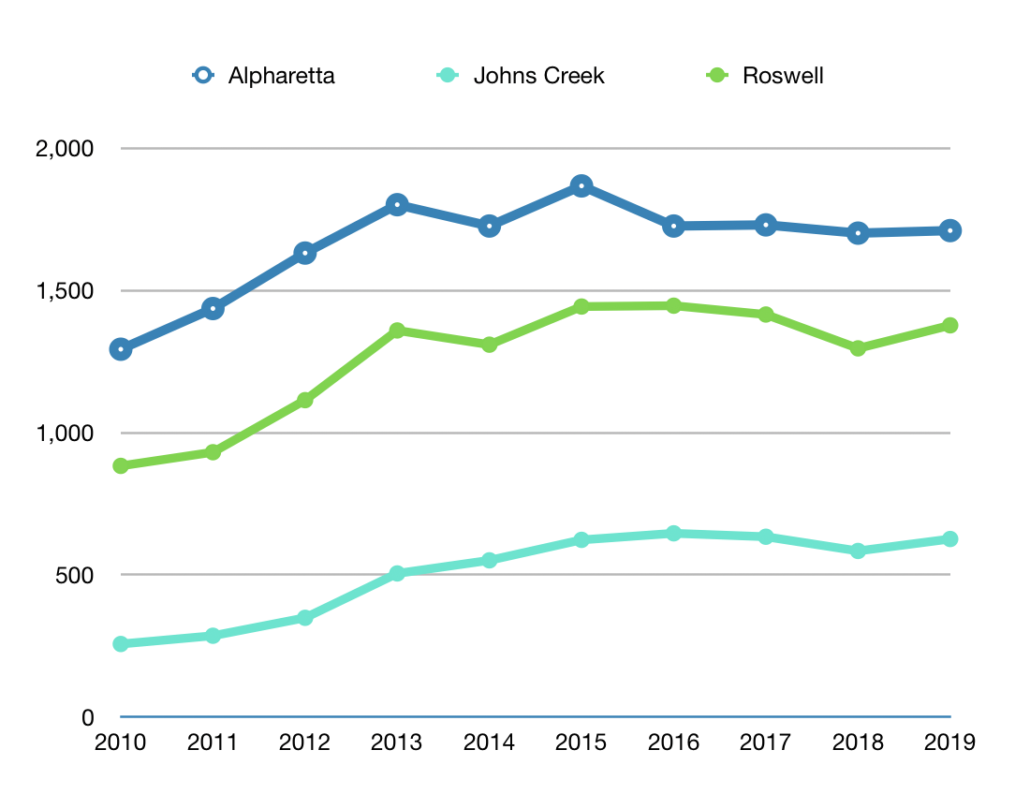
2019 ended stronger than 2018 when it comes to the number of homes selling in Alpharetta, Johns Creek, and Roswell. The chart below shows we have reversed a multi-year decline in the number of homes selling since 2016/2017. This is great news, as healthy turn over in our community provides Sellers more liquidity and Buyers more options.
Average Price
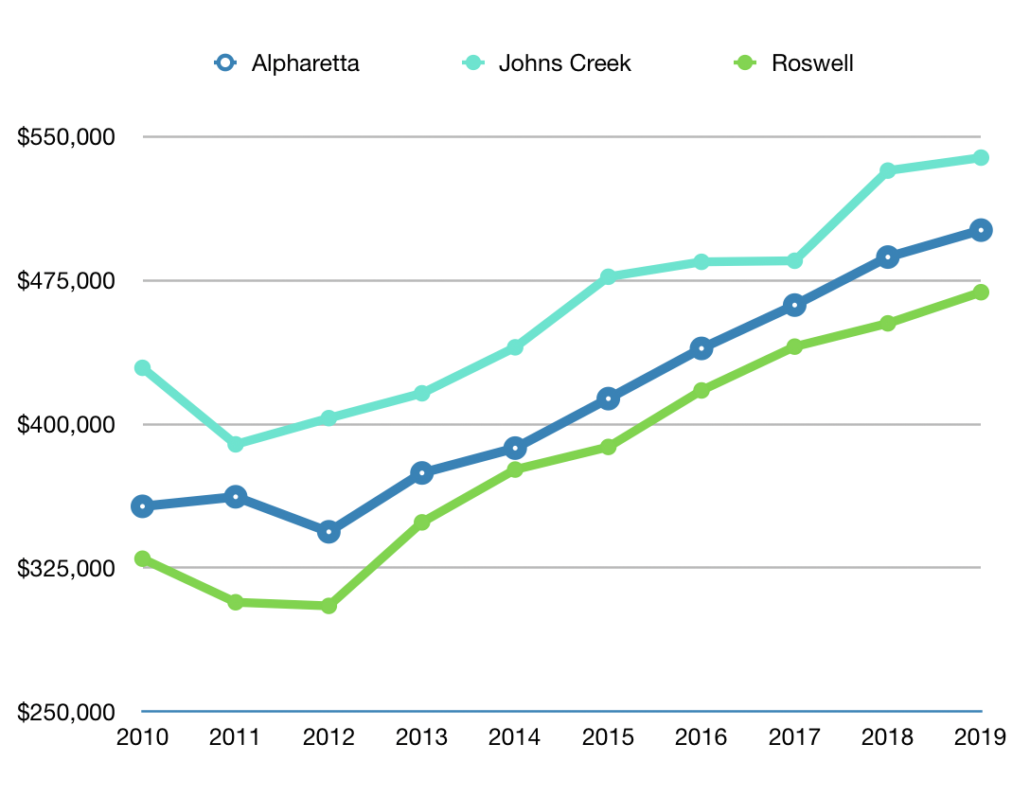
The price appreciation we have seen over the last 10 years in our community is impressive. From 2010 to 2019, Alpharetta home values have improved 40%, Johns Creek 25%, and Roswell 42%. Our outlook remains positive and we expect selling prices to hold or improve.
Days on Market
The number of days from when a home is first listed to when it goes under contract is commonly called Days on Market or Days to Sell. We use this metric to understand demand in a given market. The longer homes sit on the market, the weaker it is and often leads to lower selling prices and a lower sales price to list.
Alpharetta Average Days on Market for 2019 was 50 compared to 47 in 2018. The 10 year low was in 2016 at 43 days!
Johns Creek Average Days on Market for 2019 was 55 compared to 51 in 2018. The 10 year low was in 2015 at 47 days!
Roswell Average Days on Market for 2019 was 42 compared to 37 in 2018. Roswell is the fastest-selling market of the three cities we specialize in.